 |  |  | Plotting a trajectory on a map |
Plotting a trajectory on a map
When I go hiking or travelling, I often keep my GPS device running to generate a log. The device saves this log in a GPX-file, which looks like this:
<?xml version="1.0"?>
<gpx version="1.0" creator="maemo-mapper" xmlns="http://www.topografix.com/GPX/1/0">
  <trk>
    <trkseg>
      <trkpt lat="36.315860" lon="127.419857">
        <ele>95.00</ele>
        <time>2008-10-11T12:05:37</time>
      </trkpt>
      <trkpt lat="36.315849" lon="127.419865">
        <ele>95.00</ele>
        <time>2008-10-11T12:05:56</time>
      </trkpt>
      <trkpt lat="36.315833" lon="127.419867">
        <ele>95.00</ele>
        <time>2008-10-11T12:06:06</time>
      </trkpt>
      // ... many lines omitted ...
      <trkpt lat="36.285810" lon="127.388883">
        <ele>86.00</ele>
        <time>2008-10-11T16:34:59</time>
      </trkpt>
    </trkseg>
  </trk>
</gpx>
As you can see, the file records the location in latitude and
longitude in degrees, as well as the elevation in meters, and the time
the location was measured.
Here is zip-file gpx.zip with a few sample GPX files.
In this project we will write a program to analyze such a GPS log in GPX format.
Location class
We start by defining a class Location. It stores latitude, longitude, and elevation of a point on Earth. It also implements the minus operator - to compute the distance between two locations in meters:
data class Location(val lat: Double, val lon: Double, val ele: Double) {
  operator fun minus(rhs: Location): Double =
    haversine(lat, lon, rhs.lat, rhs.lon)
}
To compute the distance, we need to use the Haversine formula. To save you time, I have already implemented this function:
fun haversine(lat1: Double, lon1: Double,
              lat2: Double, lon2: Double): Double {
  val EARTH_RADIUS_IN_METERS = 6372797.560856
  val rlat1 = Math.toRadians(lat1)
  val rlat2 = Math.toRadians(lat2)
  val sdlat = Math.sin(Math.toRadians(lat2-lat1)/2)
  val sdlon = Math.sin(Math.toRadians(lon2-lon1)/2)
  val a = sdlat * sdlat + Math.cos(rlat1) * Math.cos(rlat2) * sdlon * sdlon
  val c = 2 * Math.atan2(Math.sqrt(a), Math.sqrt(1.0 - a))
  return EARTH_RADIUS_IN_METERS * c
}
You can use the Location class like this:
>>> val p1 = Location(36.315860, 127.419857, 95.0)
>>> val p2 = Location(36.296373, 127.417900, 397.0)
>>> p1
Location(lat=36.31586, lon=127.419857, ele=95.0)
>>> p2
Location(lat=36.296373, lon=127.4179, ele=397.0)
>>> p1 - p2
2174.5533698373715
Note how we can use subtraction for Location objects to compute the distance.
Reading the GPX file
We now need a function readGpx(fname: String): List<Location> that reads a GPX-file with the given file name, and returns the locations in a list.
A GPX file is in XML-format, so the "correct" way of reading it would be to use an XML-parser. That goes far beyond the material of CS109, so we will simply use some string matching to get the job done:
- Read the file line by line.
- If a line contains the string "<trkpt", then extract the value of latitude and longitude from the fields starting with lat=" and lon=", and save the values in two variables. Don't try to use split for this—it is easier to use the indexOf method to find the part of the string you are interested in. (Have a look at the method S.indexOf(T: String, i: Int) to restrict the search to part of the string S.)
- If a line contains the string "<ele>", then extract the value of the elevation and save it in a variable.
- If a line contains the string "</trkpt>", then create a Location object with the current values of latitude, longitude, and elevation, and append it to a list or ArrayBuffer.
Simple analysis
Write functions to compute the total length of the track in your GPX file, the minimum elevation of the track, and the maximum elevation. Here is a tip for getting the minimum and maximum elevation:
>>> val gpx = readGpx("GPX/Bomunsan1.gpx")
>>> val heights = gpx.map { it.ele }
>>> val minHeight = heights.min()
>>> val maxHeight = heights.max()
>>> minHeight
86.0
>>> maxHeight
397.0
Creating an elevation profile
In the next step, we want to create a plot of the elevation as a function of the distance traveled along the track, like this:
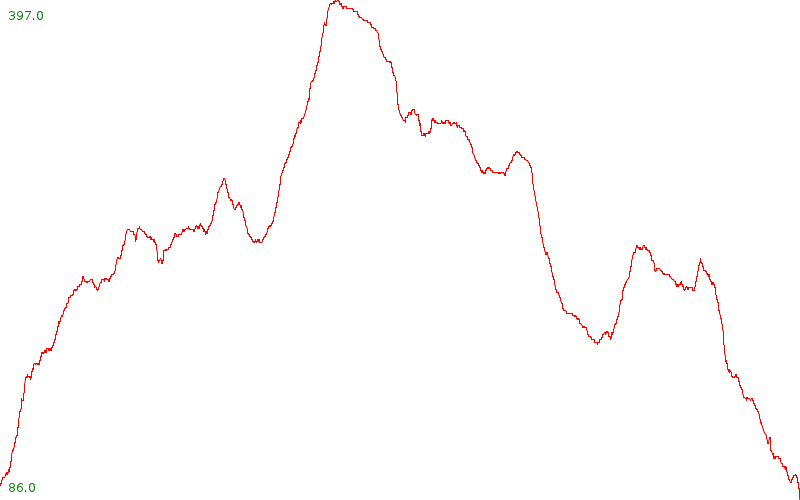
I suggest a size of about 800x600 pixels for the plot (or make it a command line parameter). Plot the minimum and maximum elevation near the left corners of the plot.
If you have time left (but not enough to do the next task), you can also plot vertical lines at 1000m intervals, or mark the extreme points by plotting the height there.
Plotting the track
The final task is a bit more advanced. Only start this if you have enough time. Our goal is to actually plot the track on a map, like this:
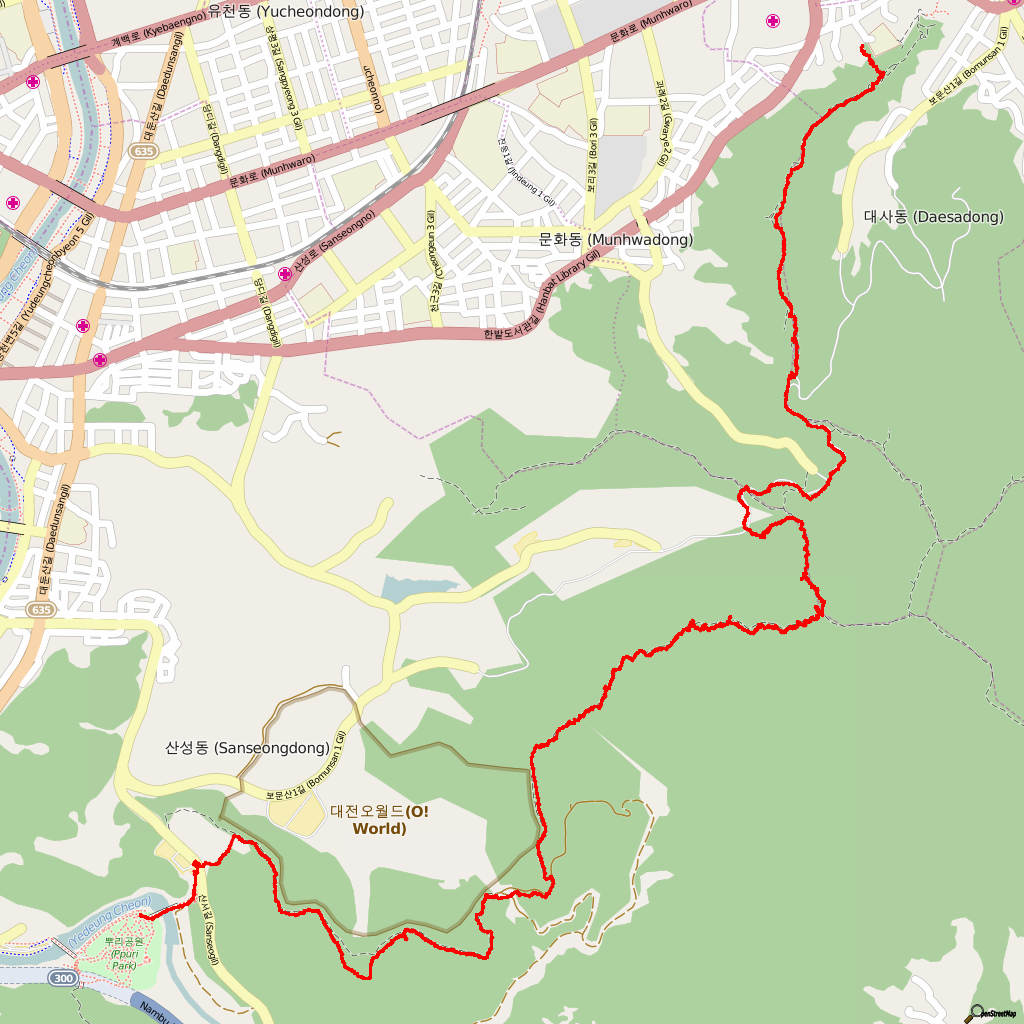
Openstreetmap and Google maps use the Mercator projection (Naver only covers Korea, so it can use a different projection that is more accurate for a smaller region, a transverse Mercator projection.)
I've written two functions that convert between latitute/longitude and Mercator coordinates:
fun mercator(lat: Double, lon: Double): Pair<Double, Double> {
  val b = Math.toRadians(lat)
  return Pair(Math.toRadians(lon), Math.log(Math.tan(b) + 1/Math.cos(b)))
}

fun latlong(x: Double, y: Double): Pair<Double, Double> {
  return Pair(Math.toDegrees(Math.atan(Math.sinh(y))), Math.toDegrees(x))
}
Here, longitude is in degrees between -180 (west) and +180 (east).
Latitude is in degrees between -85 (south) and +85 (north).
The Mercator coordinates \(x\) and \(y\) both range from \(-\pi\) to \(+\pi\), where \((0,0)\) is again the point of latitude and longitude zero.
There are 19 zoom levels, numbered 0 to 18. At zoom level 0, the whole earth fits on a 256x256 pixel square. The point with coordinates \((-\pi,-\pi)\) is the bottom left corner, the point with coordinates \((\pi,\pi)\) the top right corner. At zoom level 1, the whole earth fits on a 512x512 pixel square. Here is the earth at zoom level 1:
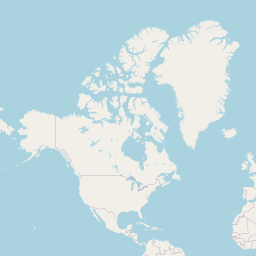
|
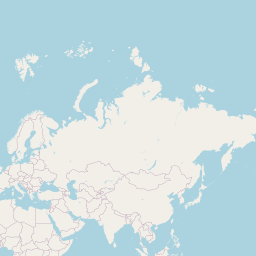
|
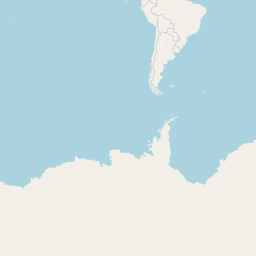 |
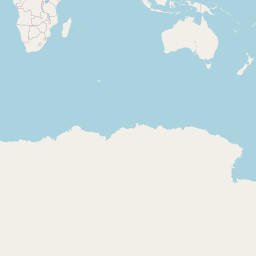 |
Fortunately, Openstreetmap provides the functionality to download a map of exactly the region you want of the size you want. The following function returns the URL where you can get this map:
fun mapurl(lat: Double, lon: Double, zoom: Int,
	   width: Int, height: Int): String =
  "http://staticmap.openstreetmap.de/staticmap.php?center=" +
  "%.4f,%.4f&zoom=%d&size=%dx%d".format(lat, lon, zoom, width, height) +
  "&maptype=mapnik"
You have to provide latitude and longitude of the center of the desired map in degrees, the zoom level between 0 and 18, and the width and height of the desired map in pixels. Accessing this URL will return a PNG file containing the desired map.
You can download a URL and store it in a file using the following function:
fun download(url: String, fname: String) {
  System.err.print("Downloading map ... ")
  val stream = java.net.URL(url)
  val rbc = java.nio.channels.Channels.newChannel(stream.openStream())
  val fos = java.io.FileOutputStream(fname)
  fos.getChannel().transferFrom(rbc, 0, 0x1000000)
  System.err.println("done")
}
Please write your program such that it only downloads the map once.
Once you have the map on your local disk, use it from there while
debugging your program.
Your strategy should be the following:
- Convert all locations on the track to Mercator projection, and compute a bounding box (minimum and maximum \(x\)- and \(y\)-coordinates) in Mercator coordinates.
- Determine a zoom-level such that the map would have a reasonable
size. If \(d\) is a distance in Mercator coordinates, then at zoom
level \(z\) this distance would be \(d \times 2^{z + 7} / \pi\) pixels.
Or, in Kotlin
d * (1 shl (z + 7)) / Math.Pi
(Here, 1 shl a is the same as \(2^{a}\) using a bit-shift operator.) Adjust your zoom level so that you get a reasonable size, say between 256 and 512. - Compute the latitude and longitude of the center of the bounding box. (Compute the bounding box and its center using Merkator coordinates, and convert those back into latitude and longitude. This is not the same as taking the center of the original latitudes and longitudes.)
- Download a map using this latitude and longitude, the correct zoom level, and a suitable size in pixels.
- Draw the track on the map by converting latitude and longitude
to pixel coordinates. First convert to Mercator coordinates, then
use the fact that one pixel corresponds to distance
Math.Pi / (1 shl (z + 7))
in Mercator coordinates.
Bonus task
Write your program such that it does not use the staticmap.openstreetmap.de service, but instead downloads map tiles directly from tile.openstreetmap.org and assembles them to a map itself. See here for details on the tile numbering.
| | | Plotting a trajectory on a map |